
As Americans return to full-time office work, road traffic has surged. According to the Department of Transportation, travel on highways and streets hit a record of 3.26 trillion miles in 2023.
However, some cities face tougher daily commutes due to factors like accidents, congestion, high gas prices, and limited access to car maintenance.
Oakland, California

In Oakland, California, drivers endure the toughest driving conditions among all the cities in America. The city has a high rate of fatal car accidents, costly gas prices, and prolonged daily commutes for workers.
Oakland ranks poorly for the cost of car ownership. The city also experiences the sixth-highest gas prices nationwide, averaging $4.52 per gallon. Additionally, drivers here face extensive traffic congestion, spending an average of 97 hours annually in traffic.
Miami, Florida
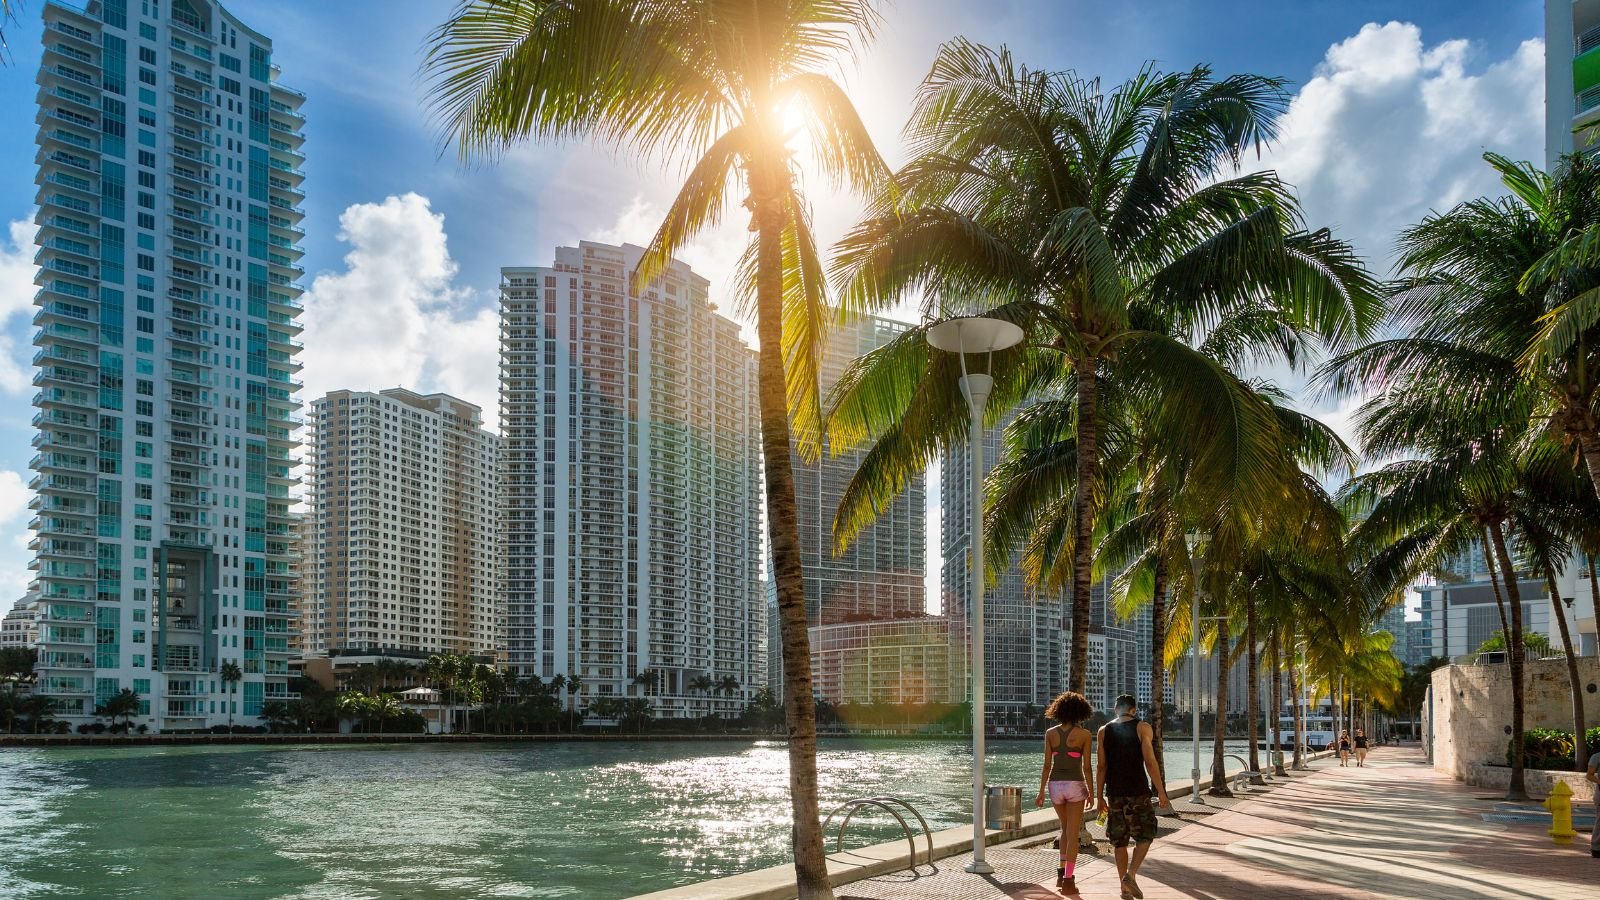
Miami, Florida is a city where you have high insurance rates, lengthy communes, and sluggish rush hour speeds. This results in a taxing driving experience for residents. The city ranks third worst for the overall cost of car ownership. Miami drivers face the second-highest car insurance premiums nationwide, averaging $3,865 annually.
Plus, Miami drivers spend the fifth highest amount on gas due to traffic congestion, totaling $1,773 annually.
San Francisco, California

San Francisco imposes the highest gas prices among all the cities and it has agonizingly slow commutes. Ranking sixth worst for cost car ownership, this city’s average gas price of $4.72 tops the list. Commuters here spend an average of 20 minutes 50 seconds traveling six miles which is the third longest time in this list.
Houston, Texas

Houston in Texas racks up the longest annual hours lost in traffic. It indicates the significant gasoline expenses due to congestion. The city ranks twelfth worst for access to car maintenance.
The metro area in the city harbors the seventh fewest car repair shops which hinders prompt vehicle servicing for residents. Moreover, Houston commuters endure the eleventh longest average commute time of 30 minutes and 9 seconds.
Philadelphia, Pennsylvania

Philadelphia exhibits sluggish traffic speeds and hefty gas expenses, especially during the rush hour. Commuters here endure the third slowest rush hour traffic speed. They spend the fourth highest amount of time on traffic annually. Philadelphia drivers shell out the fourth highest amount on gas due to high traffic congestion, averaging $1,925 per year.
New York City, New York

New York City has the highest cost of car ownership and the longest average commute time. Drivers in the city suffer the third highest gas expenses due to traffic congestion, tallying $1,976 annually. Furthermore, commuters here endure the longest average commute time at 40 minutes and 8 seconds.
Chicago, Illinois
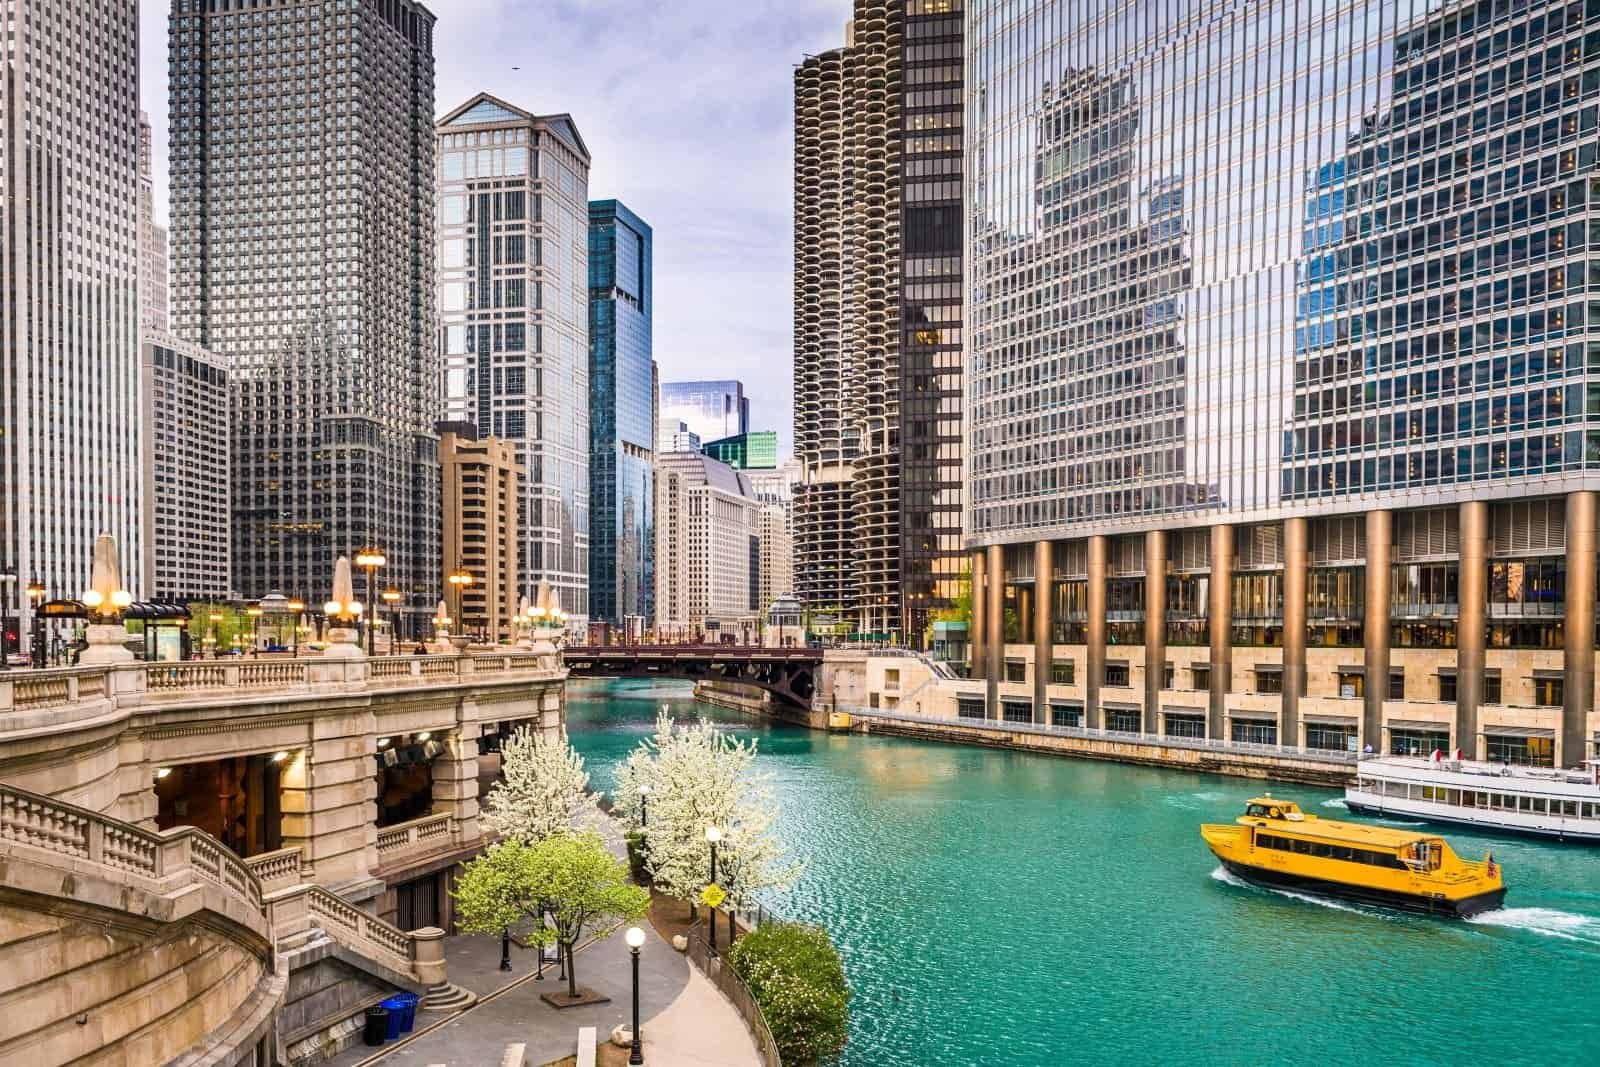
Chicago, Illinois, records the highest annual hours lost in traffic nationwide, reflecting the substantial gas expenditures of its citizens. Ranking third worst for overall driving experience, Chicago drivers contend with the sixth-longest average commute, clocking in at 34 minutes and 30 seconds.
Moreover, drivers in the metro area spend the highest amount on gas due to traffic congestion, totaling $2,618 annually.
Atlanta, Georgia
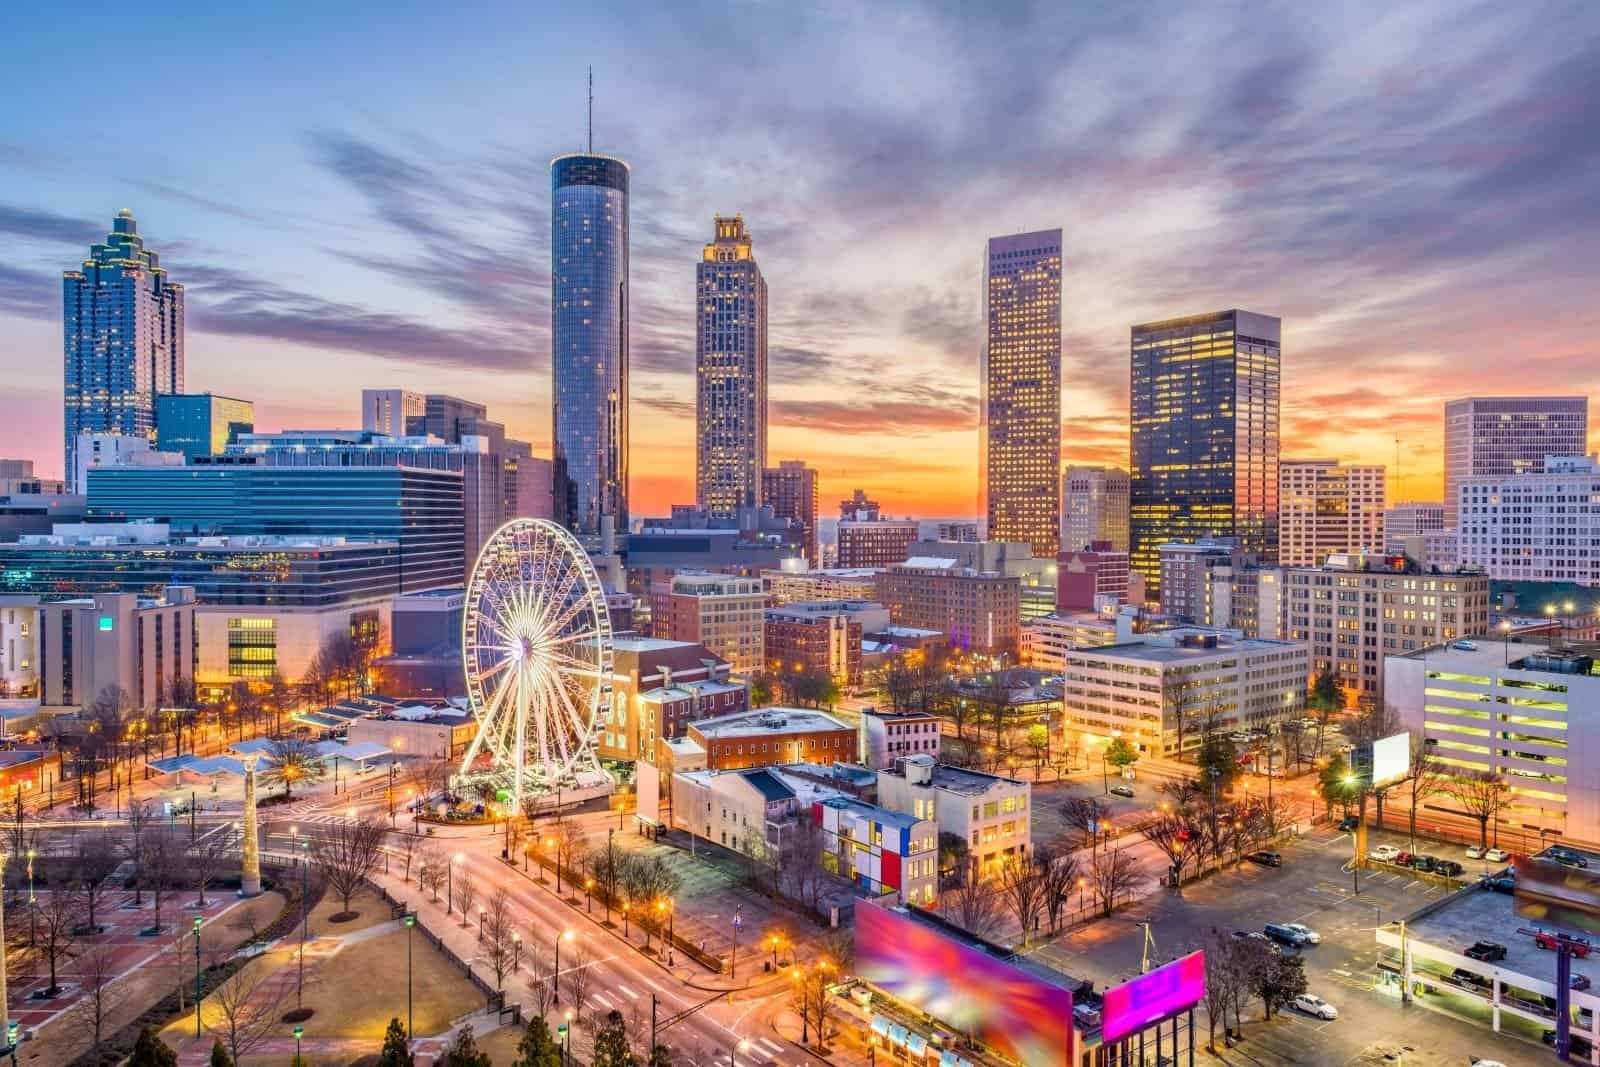
Atlanta, Georgia, emerges as an unsafe city for drivers, with a notable prevalence of fatal car accidents annually. Commuters here face the sixth-longest average commute, lasting 33 minutes and 9 seconds.
Commuters also spend the eleventh highest amount of time in traffic annually. Additionally, Atlanta registers the sixth-highest number of fatal crashes per 100,000 city residents.
Dallas, Texas
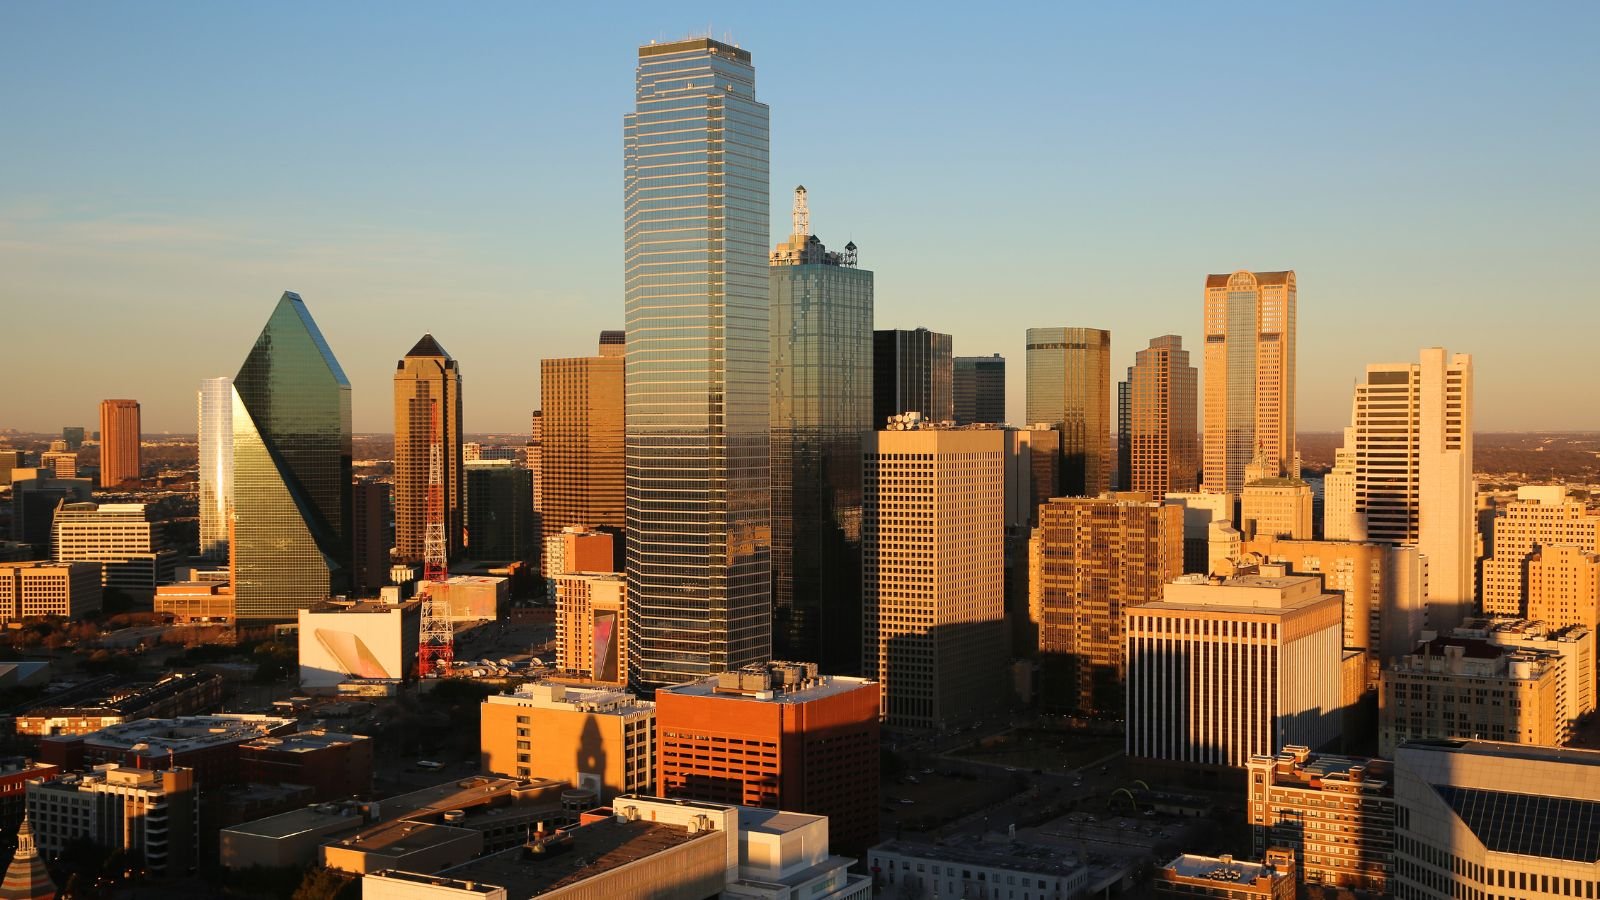
Dallas is propelled by lengthy commutes, high insurance premiums, and a significant number of fatal car accidents. Ranking tenth worst for safety, the city harbors the tenth highest number when it comes to car accidents per 100,000 residents.
Drivers in Dallas, Texas endure the twelfth-slowest average downtown speed and pay the seventh-highest amount for car insurance.
Portland, Oregon
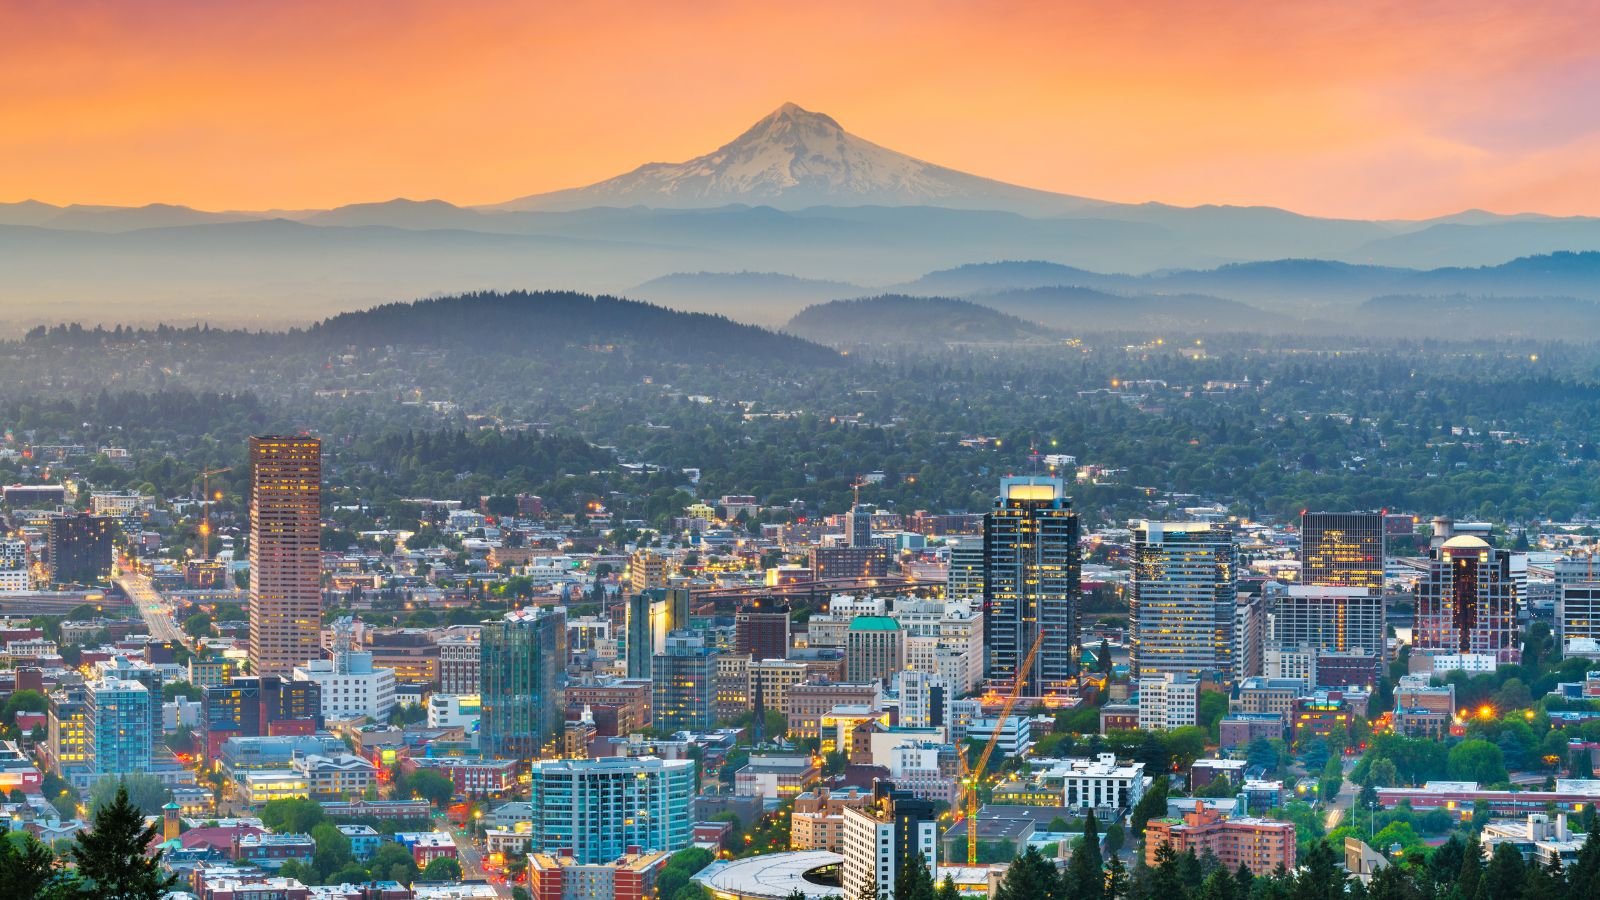
Portland, Oregon features a high rate of car thefts and frequent rainy days. The city ranks the tenth worst for overall driving experience and the second highest for the average number of days with precipitation annually, at 153 days.
Plus, drivers in the metro area contend with the sixth-highest rate of car thefts and pay $3.80 per gallon of regular gasoline on average.
Los Angeles, California
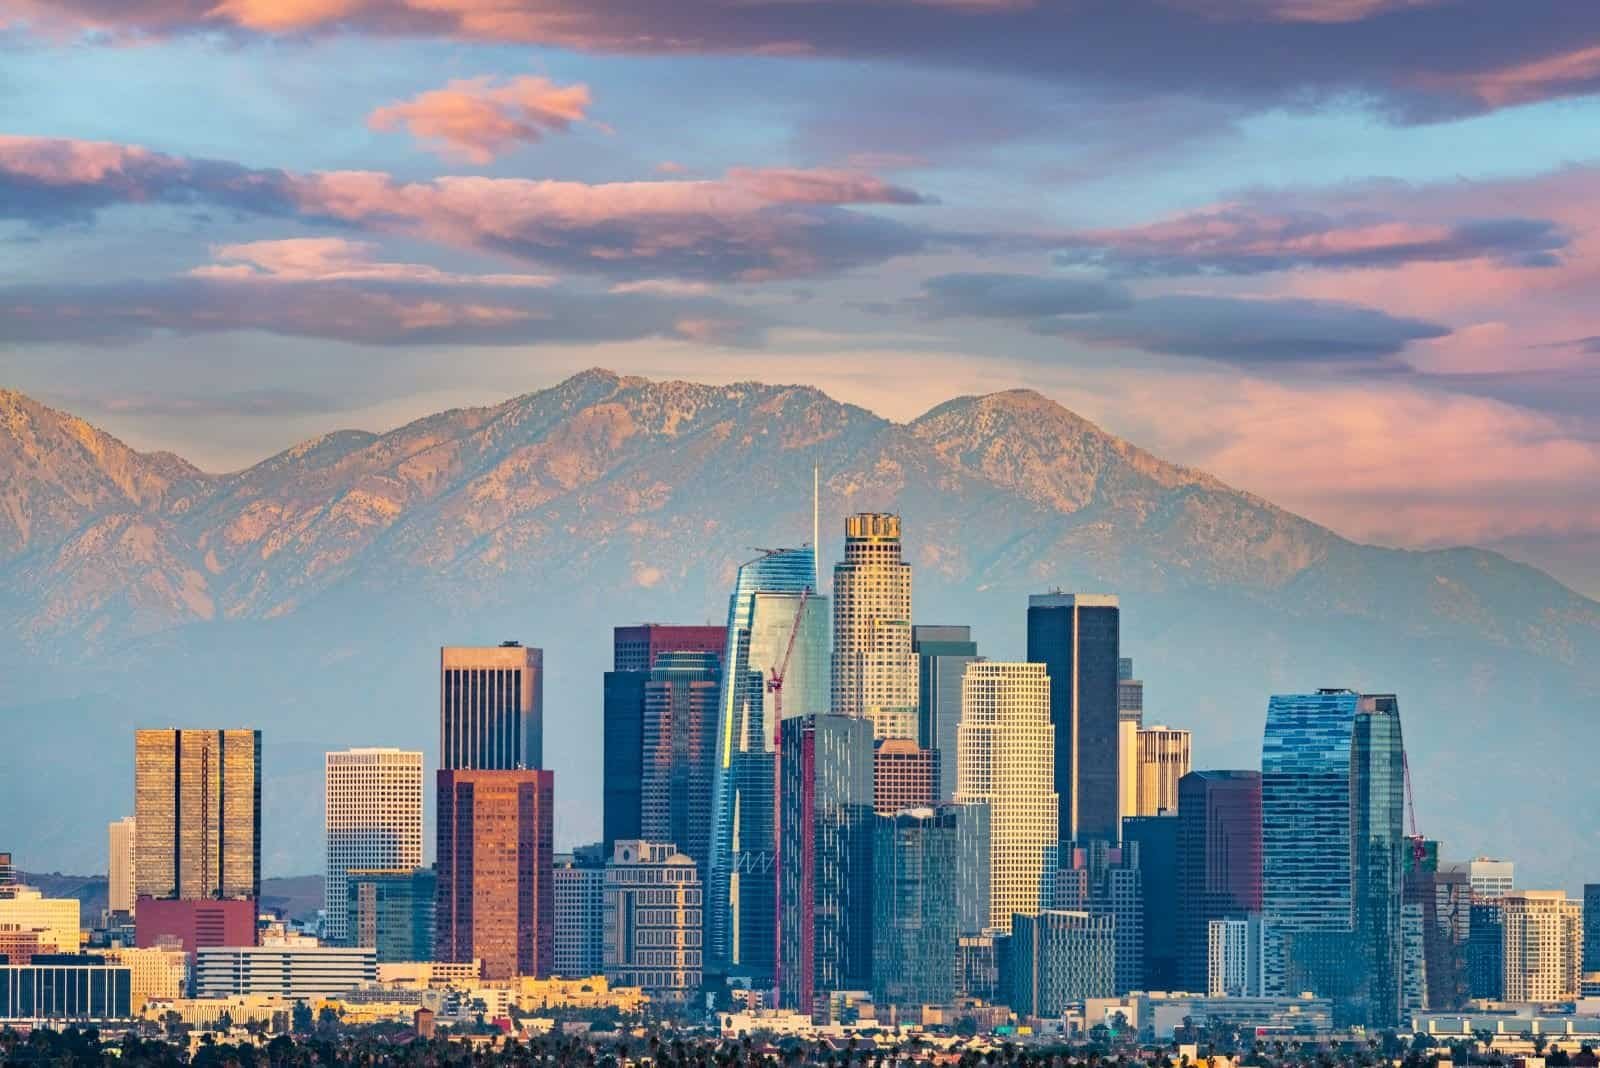
Los Angeles drivers face significant challenges, including a higher number of accidents and car thefts. LA ranks eleventh as the worst city to drive in. The city reports 7.46 fatal car accidents per 100,000 residents, indicating serious safety issues.
Car thefts are also prevalent, with 532.39 incidents per 100,000 residents. Combined with heavy traffic congestion and long commute times, driving in the city can be quite stressful.
Seattle, Washington
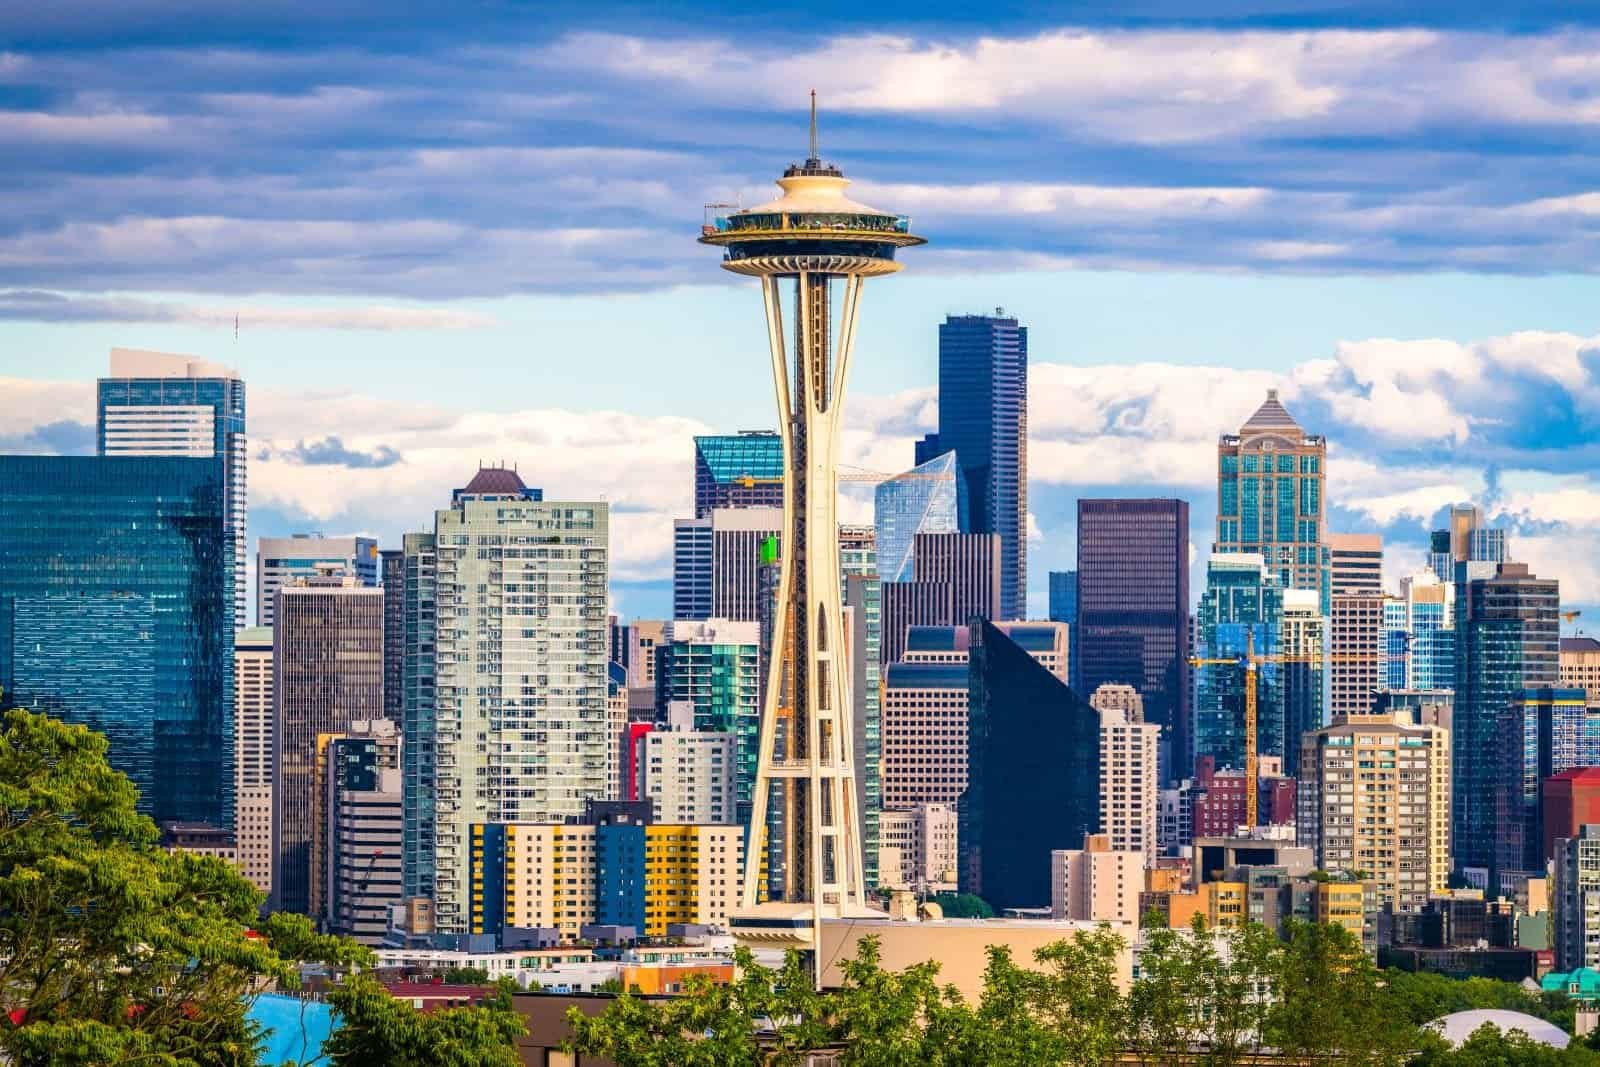
Ranking in the eighteenth position, Seattle drivers experience a moderate number of fatal car accidents and a high rate of car thefts. The city has 4.36 fatal car accidents per 100,000 residents which points to safety concerts.
Car thefts are also more common. The city’s frequent rain and hilly terrain further complicate driving conditions. This makes it challenging for drivers, especially motorists.
Long Beach, California
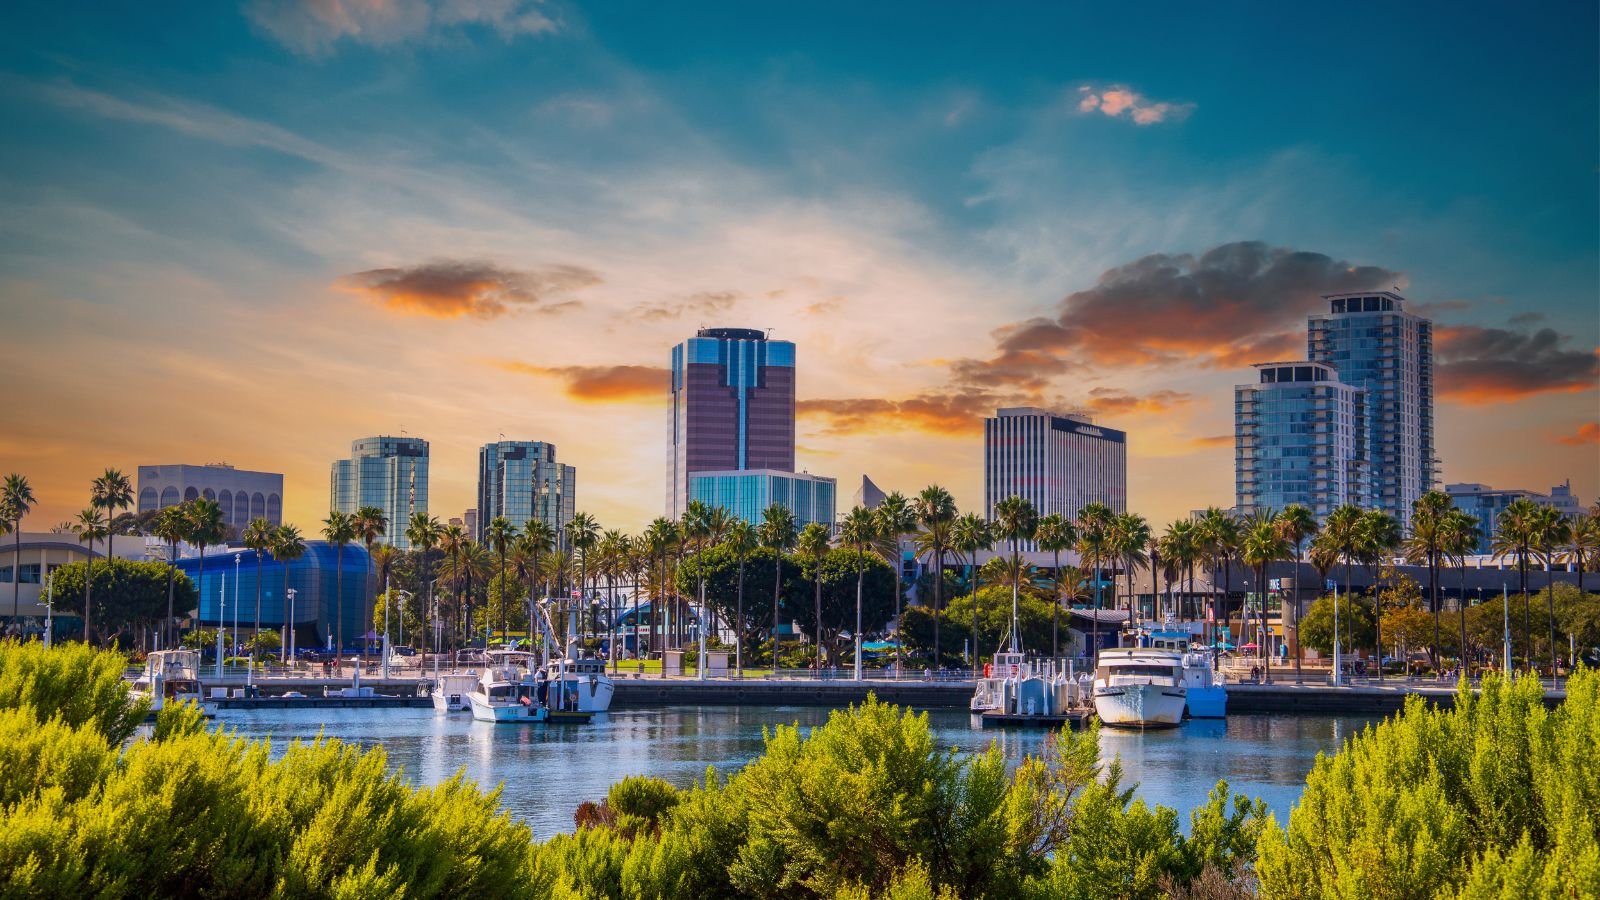
Long Beach in California ranks twentieth in terms of the worst cities to drive in. Here drivers have to deal with a significant number of car accidents. Car thefts occur at a rate of 532.39 incidents per 100,000 residents.
Coupled with traffic congestion and limited parking, driving in Long Beach can be demanding for residents and visitors alike.
Austin, Texas
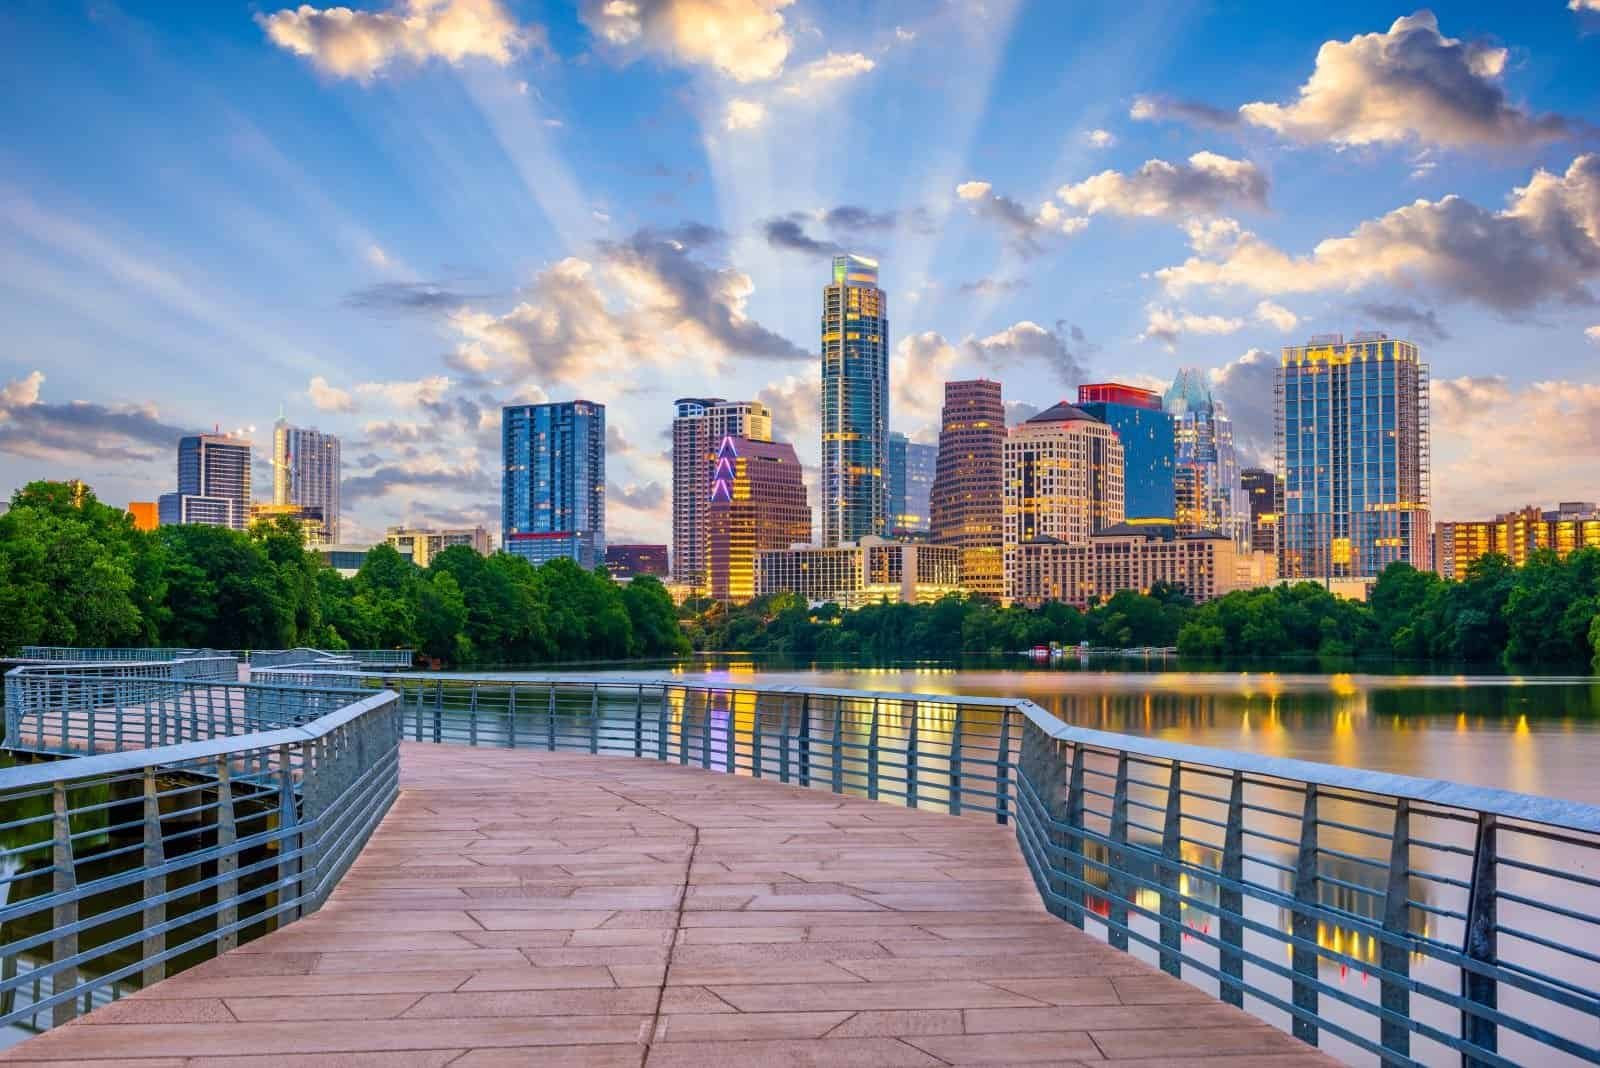
Austin drivers face a high number of fatal car accidents but a relatively lower rate of car thefts. The city ranks twenty-first on the list of worst experiences for driving. With 9.75 fatal car accidents per 100,000 residents,
Austin’s growing population and traffic congestion contribute to a stressful driving environment.
Las Vegas, Nevada
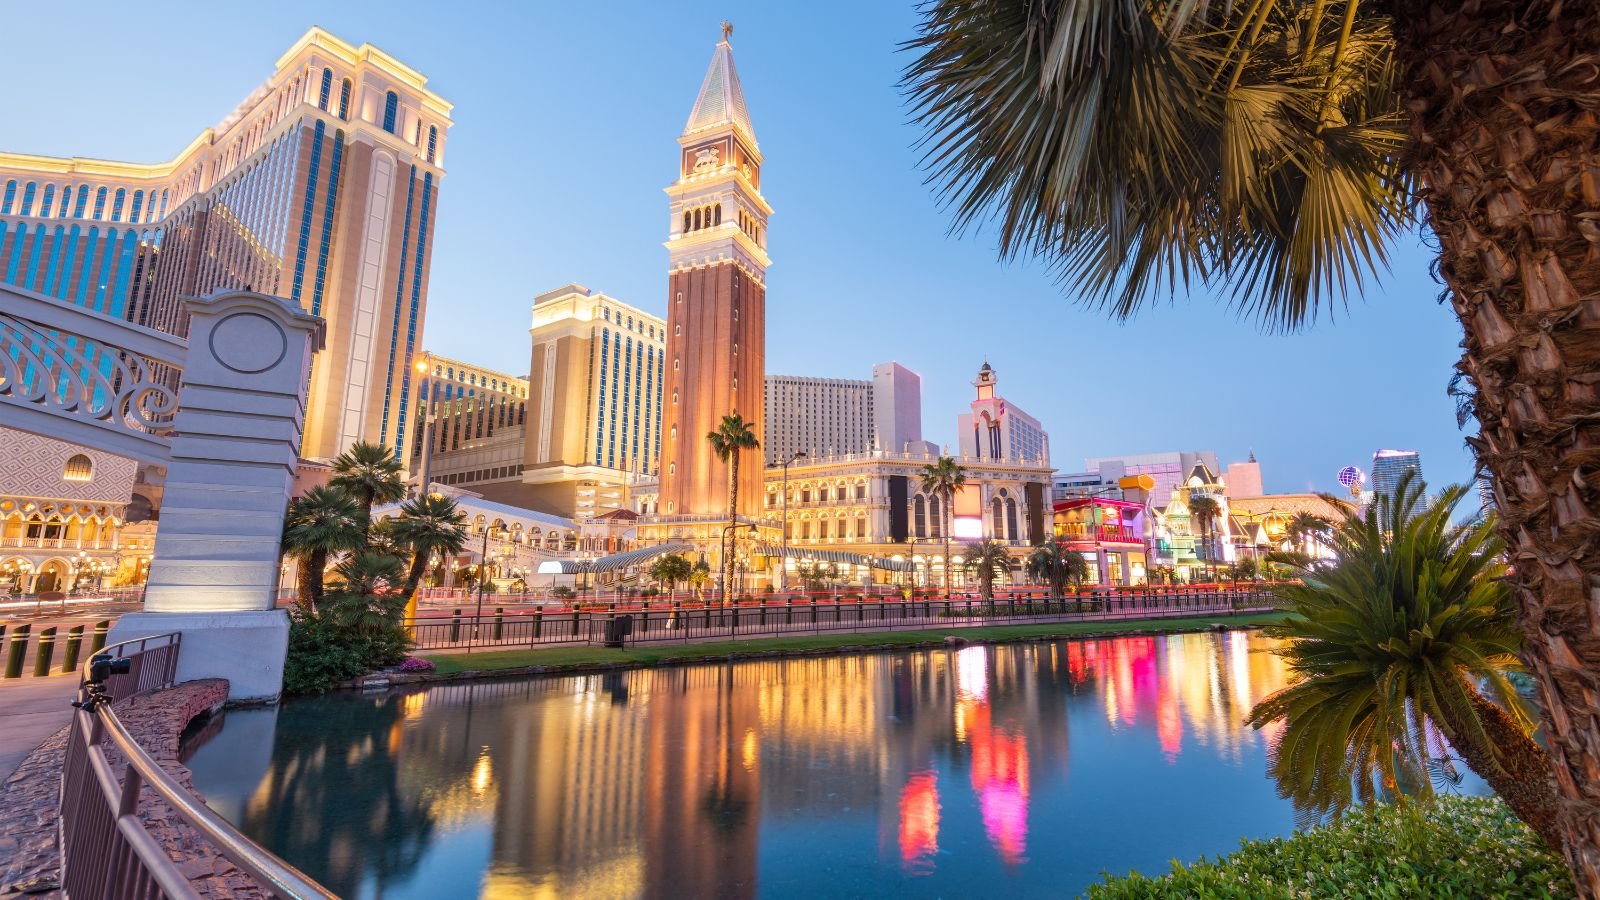
Las Vegas ranks sixteenth when it comes to the worst driving experience. The city experiences 4.88 fatal car accidents per 100,000 residents, reflecting significant safety concerns. Additionally, car thefts are also prevalent. These factors, along with the city’s vibrant nightlife and tourist traffic, contribute to making Las Vegas one of the more challenging cities for drivers